Note
Click here to download the full example code
4 models at a time
This examples shows how to generate directivity patterns for all 4 currently implemented source models.
We’ll run the 4 models for the same ka values \(ka=1,5,10\) and compare the patterns.
Important to note
As you may notice, some of the models require numerical inputs of a particular format (mpmath float for instance). This is important to pay attention to, and may otherwise lead to avoidable errors.
Lengthy computations ahead
Some of the models are computationally intensive and do take a long time, depending on your system. The piston in a sphere can take over 10 minutes to run for example!!
import mpmath
import numpy as np
import matplotlib.pyplot as plt
from beamshapes import piston_in_infinite_baffle as piston_infbaf
from beamshapes import piston_in_sphere_directivity
from beamshapes import cap_in_sphere_directivity
from beamshapes import point_source_on_a_sphere_directivity

# sphinx_gallery_thumbnail_path = '_static//piston_sphere_baffle.png'


# the 'if__name__' pattern for a module is odd - but is required when running code with
# the multiprocessing package in Windows. The example should work without the if __name__
# in Linux systems.
if __name__ == '__main__':
ka_values  = [1, 5, 10]
a = 0.01 # piston of 1cm radius
R = 0.1 # radius of a sphere
alpha = mpmath.pi/6
a_value = R*mpmath.sin(alpha)
angles = np.linspace(0,-np.pi,100)
piston_infbaf_D = np.zeros((angles.size, len(ka_values)))

print('Calculating piston in an infinite baffle....')
for j,each_ka in enumerate(ka_values):
    k_value = each_ka/a
    parameters = {'k':k_value, 'a':a}
    _, piston_infbaf_D[:,j] = piston_infbaf.piston_in_infinite_baffle_directivity(angles,
                                                                               parameters)
Now calculate the piston in sphere
piston_in_sphere_D = np.zeros((angles.size, len(ka_values)))

print('Calculating piston in a sphere....')
for j,each_ka in enumerate(ka_values):
    k_value = each_ka/a_value
    parameters = {'k':k_value, 'a':a_value, 'R': R, 'alpha':alpha}
    A_n, piston_in_sphere_D[:,j] = piston_in_sphere_directivity(angles,
                                                                    parameters)
Now calculate oscillating cap of a sphere
R = mpmath.mpf(0.1) # radius of a sphere
cap_of_sphere = np.zeros(piston_infbaf_D.shape)

print('Calculating oscillating cap of a sphere....')
for j,each_ka in enumerate(ka_values):
    k_value = each_ka/a_value
    parameters = {'k':k_value, 'a':a_value, 'R': R, 'alpha':alpha}
    _, cap_of_sphere[:,j] = cap_in_sphere_directivity(angles,
                                                                    parameters)
Calculate the beamshape of a point on a sphere
R = 0.1
point_on_sphere = np.zeros(piston_infbaf_D.shape)

print('Calculating point on a sphere....')
for j, each_ka in enumerate(ka_values):
    k_value = each_ka/R
    parameters = {'k':k_value, 'R':R}
    _, point_on_sphere[:,j] = point_source_on_a_sphere_directivity(angles, parameters)
def set_ylim():
    plt.ylim(-52,0)

subplot_labelx, subplot_labely = -0.05, 0.9
line_types = ['dotted', 'dashed', 'solid']


plt.figure(figsize=(5,5))
a0 = plt.subplot(221, projection='polar')
for j,ka in enumerate(ka_values):
    plt.plot(angles, piston_infbaf_D[:,j], color='k', linestyle=line_types[j])
    plt.plot(-angles, piston_infbaf_D[:,j], color='k', label=f'$ka$={ka}', linestyle=line_types[j])
a0.set_theta_zero_location('N')

a0.set_rlabel_position(0)  # Move radial labels away from plotted line
tick_angles = [0,45,90,135, 180,225,270,315]
tick_labels = []
for each in tick_angles:
        tick_labels.append(f'{each}'+'$^{\circ}$')
plt.yticks([-12,-24,-36,-48],['',-24,'', -48], fontsize=6)

plt.xticks(np.radians(tick_angles) ,tick_labels , fontsize=6)
a0.xaxis.set_tick_params(pad=-3.5)

set_ylim()
plt.text(subplot_labelx, subplot_labely, 'A', transform=a0.transAxes,
                         fontsize=8)

a1 = plt.subplot(222, projection='polar')
for j,ka in enumerate(ka_values):
    plt.plot(angles, piston_in_sphere_D[:,j], color='k', linestyle=line_types[j])
    plt.plot(-angles, piston_in_sphere_D[:,j], color='k', label=f'$ka$={ka}', linestyle=line_types[j])
a1.set_theta_zero_location('N')
plt.yticks([-12,-24,-36,-48], fontsize=6)
a1.set_rlabel_position(0)  # Move radial labels away from plotted line
tick_angles = [0,45,90,135, 180,225,270,315]
tick_labels = []
for each in tick_angles:
    tick_labels.append(f'{each}'+'$^{\circ}$')


plt.yticks([-12,-24,-36, -48],['',-24,'', -48], fontsize=6)

plt.xticks(np.radians(tick_angles) ,tick_labels , fontsize=6)
#a1.tick_params(axis='both', pad=0.5)
a1.xaxis.set_tick_params(pad=-3.5)
plt.legend(loc=(-0.27,-0.23), frameon=False, fontsize=7)

plt.text(subplot_labelx, subplot_labely, 'B', transform=a1.transAxes,
                         fontsize=8)
set_ylim()
a2 = plt.subplot(223, projection='polar')
for j,ka in enumerate(ka_values):
    plt.plot(angles, cap_of_sphere[:,j], color='k', linestyle=line_types[j])
    plt.plot(-angles, cap_of_sphere[:,j], color='k', label=f'$kR$=$ka$={ka}', linestyle=line_types[j])
a2.set_theta_zero_location('N')
plt.yticks([-12,-24,-36, -48],['',-24,'', -48], fontsize=6)

a2.set_rlabel_position(0)  # Move radial labels away from plotted line
tick_angles = [0,45,90,135, 180,225,270,315]
tick_labels = []
for each in tick_angles:
    tick_labels.append(f'{each}'+'$^{\circ}$')

plt.xticks(np.radians(tick_angles) ,tick_labels , fontsize=6)
a2.xaxis.set_tick_params(pad=-3.5)

plt.text(subplot_labelx, subplot_labely, 'C', transform=a2.transAxes,
                         fontsize=8)
set_ylim()
a3  = plt.subplot(224, projection='polar')
for j,ka in enumerate(ka_values):
    plt.plot(angles, point_on_sphere[:,j], color='k', linestyle=line_types[j])
    plt.plot(-angles, point_on_sphere[:,j], color='k', label=f'$kR$=$ka$={ka}', linestyle=line_types[j])
a3.set_theta_zero_location('N')
plt.yticks([-12,-24,-36, -48],['',-24,'', -48], fontsize=6)

a3.set_rlabel_position(0)  # Move radial labels away from plotted line
tick_angles = [0,45,90,135, 180,225,270,315]
tick_labels = []
for each in tick_angles:
    tick_labels.append(f'{each}'+'$^{\circ}$')
plt.xticks(np.radians(tick_angles) ,tick_labels , fontsize=6)
a3.xaxis.set_tick_params(pad=-3.5)
set_ylim()
plt.text(subplot_labelx, subplot_labely, 'D', transform=a3.transAxes,
                         fontsize=8)

#plt.savefig('../docs/source/_static/piston_sphere_baffle.png', bbox_inches='tight', dpi=600)
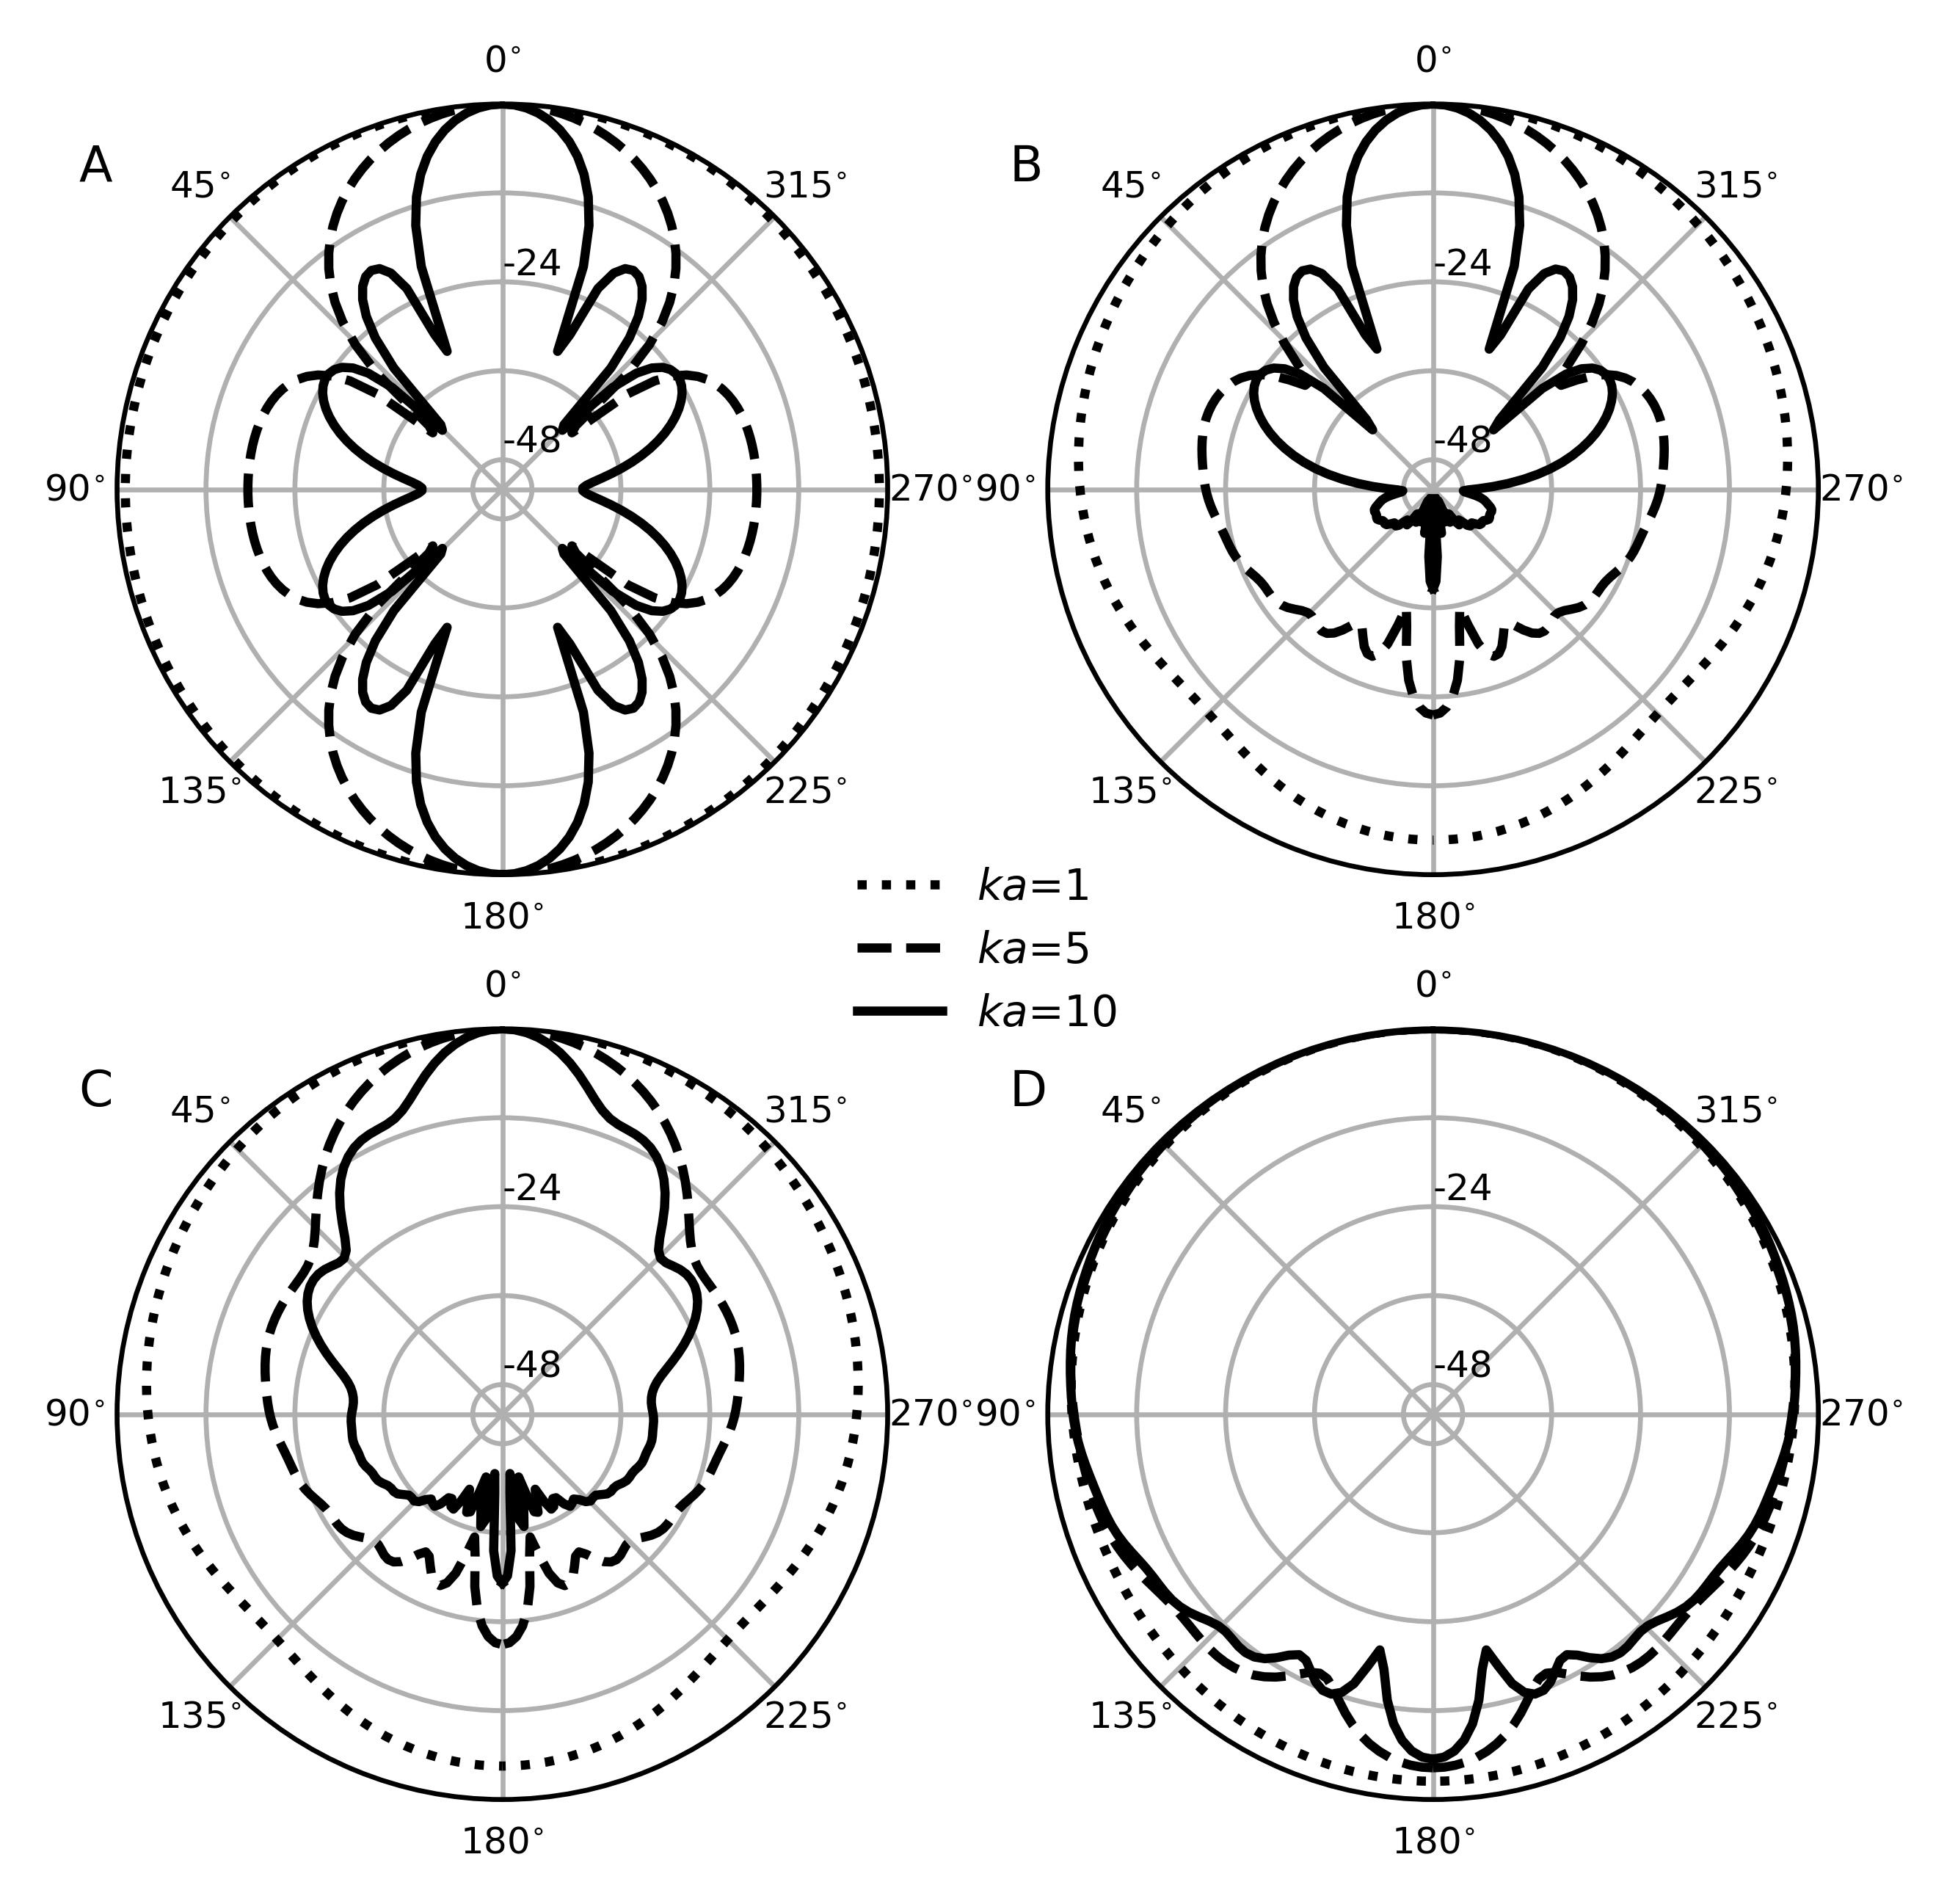
Directivity patterns \((D_{\theta}/D_{0})\) in dB of the currently implemented sound sources for a common set of ka values for comparison, where k is the wavenumber (\(\frac{2 \pi\times f}{c}\)) and a is the piston radius - or its equivalent. The directivity pattern shows the ratio between the off-axis sound level at (θ◦) to the on-axis level at (0◦) in decibels. A) piston in an infinite baffle B) piston in a sphere with the half-angle aperture α = 30 ◦ , and where the piston radius a = R sin α C) oscillating cap of a sphere with α = 30 ◦ , and the equivalent piston radius is a = R sin α D) vibrating point on a sphere, here the kR = ka for comparison with the other models.
Total running time of the script: ( 0 minutes 0.000 seconds)